
I’ve made an excel file that some may find helpful for understanding the concept of “gradient descent in error” using the delta rule.
Consider the following very simple 3-unit model:
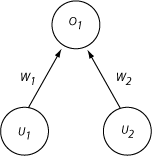
Two input units (u1 and u2) connect directly to one output unit (o1), via two weights (w1 and w2). Because there are only 2 weights, it is possible to plot, for any given configuration of weights, any particular set of training patterns, and any activation function, the total squared error at the output. Such a plot provides a graphical representation of the concept of “gradient descent in error.”
To see this, download this Excel file: ThreeUnitDeltaWtPlots. (There are macros in it to implement the sigmoid and threshold functions. Windows may not let you use these macros depending on your security settings). On the first worksheet, you see:
- Four training patterns (A, B, C and D) in the top-left yellow box.
- A range of possible values for Weight 1 and Weight 2 (top middle yellow box).
- An activation function (linear, thresholded, sigmoid) in the top-right yellow box.
- A big table showing, for each pair of weights, the output activation generated for all 4 patterns (A, B, C and D), and the total squared error, for each of the 3 activation functions.
- A plot of the total squared error for each configuration of weights, for a given activation function (indicated by the “l”, “t”, or “s” in cell X1 in the sheet).
You can see that, given some starting configuration of weights, there is typically some way of changing the weights that will reduce the total error. The learning rule makes this weight adjustment–it alters the configuration of weights so as to move “down” the error gradient depicted in the graph.
You can explore how this gradient changes with different training patterns (just change the values in the top-left yellow area), the range of weights plotted (change the values in the fields labelled “Weight 1 range” and “Weight 2 range”), or the activation function used by the output unit (change the letter in cell X1). If, for instance, you change the activation function to “threshold,” the error landscape becomes much more blocky, since any given set of weights generates either a 1 or a 0 activation on the output unit (which means the squared error summed across the 4 patterns can only take on the values 0, 1, 2, 3 or 4)
What about the other worksheets? These show, for each configuration of starting weights, activation function, and training set, how the weights and total error change, using the delta rule, as the network steps successively through patterns A, B, C and D. So, the first matrix labelled A on the “LnWtChange” sheet shows the values for W1 and W2 after the network has been trained once with pattern A, given the learning rate indicated in cell I1, as well as the total error generated by all 4 patterns with this weight configuration. The next matrix, labelled B, shows the next set of weights and total error generated by the delta rule when pattern B is subsequently presented; then comes C, D, A, B, and so on. The same changes are also shown for Threshold and Sigmoidal activation functions in the sheets with corresponding labels.
Finally, the sheets with “ErrPlots” extensions show the total error across all patterns after each pattern presentation. Ideally, this should go consistently down, but you will see that it varies depending on the learning rate and the particular training corpus. (All of these values will automatically change if you change any of the yellow boxes in the first worksheet). You can play around with changes to the various patterns or to the learning rate, and see how these affects the reduction of error in the different activation functions.
It is also interesting to look at how the weights change from pattern presentation to pattern presentation. You can do this easily by generating a scatter plot of the all the pairs of weights at different points during training. For instance, here is the set of starting weights (generated by scatter-plotting A10:B59 on the LinWtChange sheet).
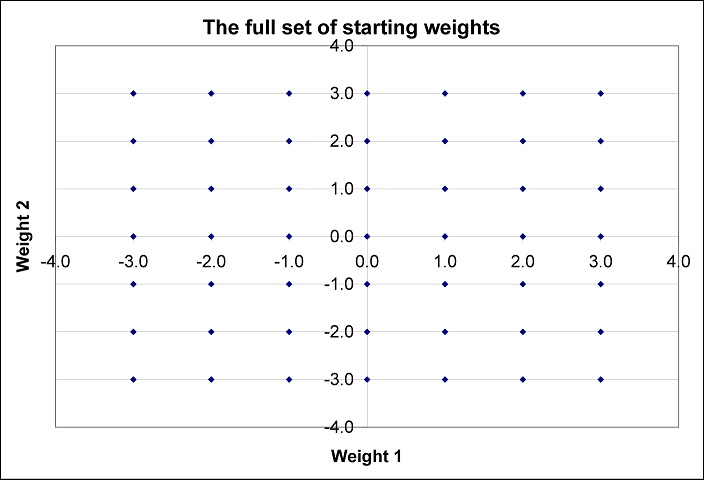
It just shows that the different starting weights are evenly spread around the space. In contrast, here are the final set of weights generated by the delta rule after training with the default corpus using a linear activation function (generated by plotting DY10:DZ59 on the same worksheet).
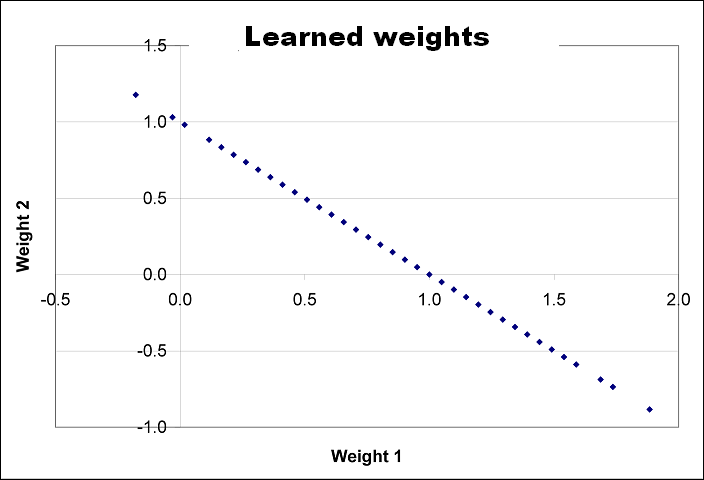
The final configuration of weights always lands somewhere on a straight line in the weight space! So, you can think of learning as moving the weights from whereever they begin to a point on a straight line in weight space. The exact slope and intercept of this line depends on the training set.